Email Marketing KPIs That Actually Drive Business Growth
- Prince Yadav
- Jun 13, 2025
- 14 min read

Understanding Email Marketing KPIs Beyond The Numbers
Think of your email marketing KPIs like a checkup for your campaigns. They give you a peek under the hood and show you what's really going on. So many marketers get caught up in vanity metrics—numbers that look great on paper but don't actually help the business grow. That's why it's so important to understand the why behind your email marketing KPIs.
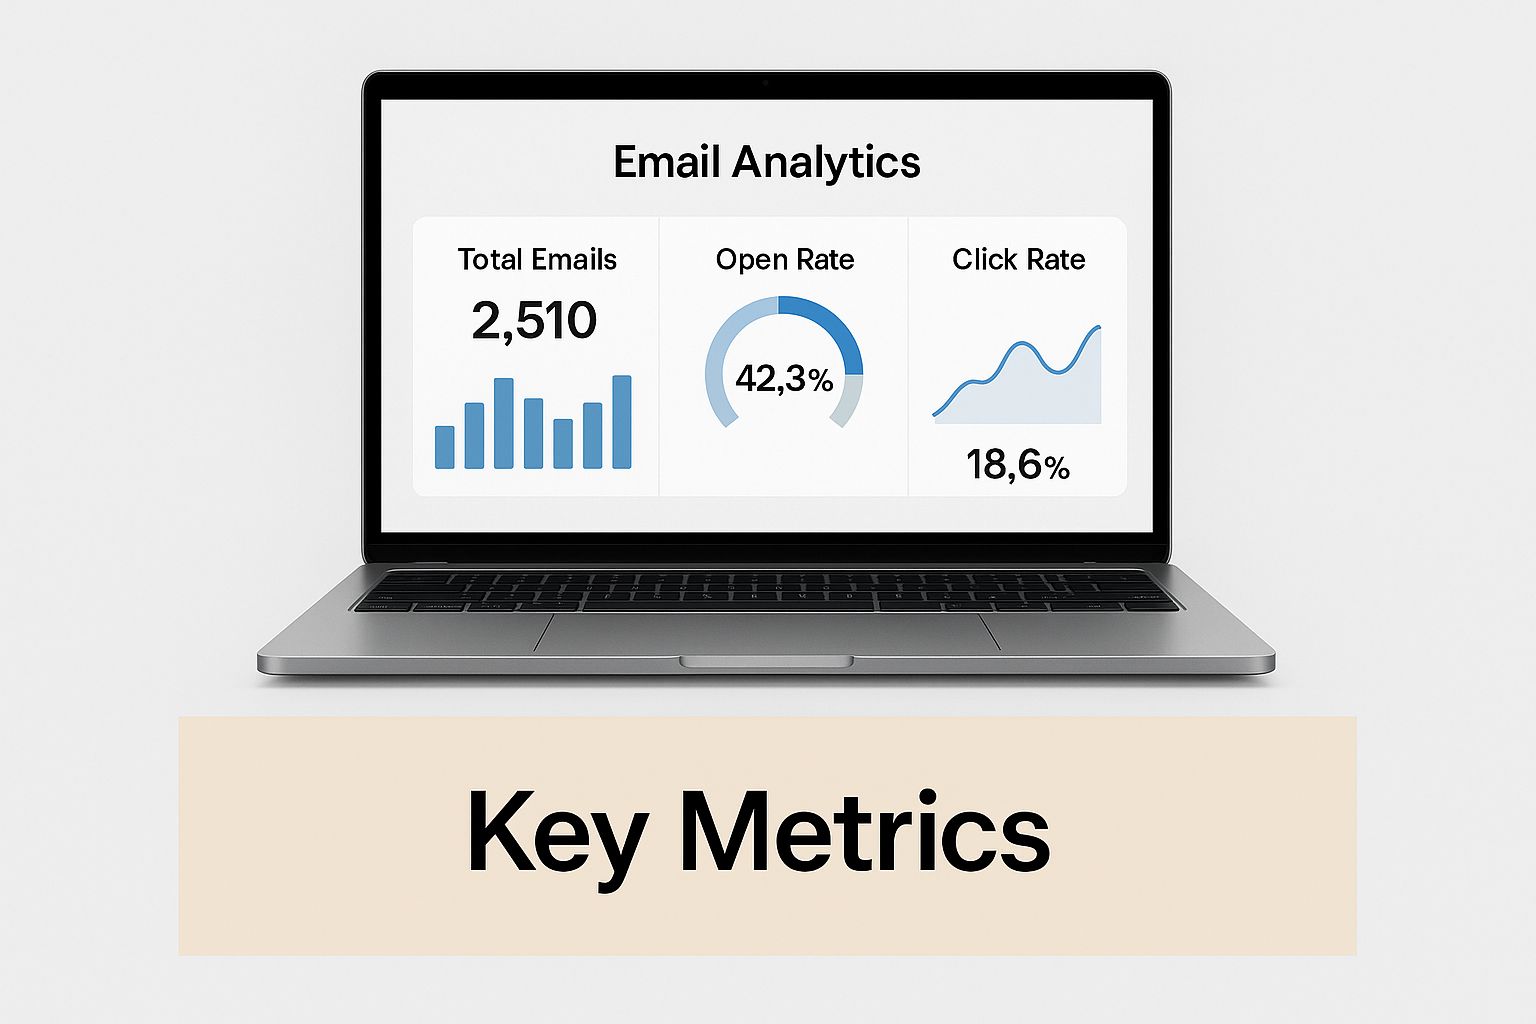
The infographic above shows a simplified email analytics dashboard, highlighting the important metrics. Notice how it shows the relationship between opens, clicks, conversions, and finally, revenue. This visual reminds us to look at the bigger picture and see how each piece contributes to the overall success of our email strategy.
For example, a high open rate might seem fantastic. But if those opens aren't turning into clicks and conversions, it's a red flag. Maybe your subject line is intriguing, but the email itself doesn't deliver. Plus, focusing only on open rates means you're missing out on another critical factor: deliverability. Want to dive deeper into that? Check out our guide on improving email deliverability.
This screenshot from Mailchimp gives us some helpful industry benchmarks for email marketing KPIs. It shows average open and click-through rates across various industries, giving you a starting point to compare your own performance. This data highlights how important it is to understand your industry's context. A "good" open rate in one industry might be considered low in another.
This all boils down to truly understanding your audience and how they behave. Your email marketing KPIs should directly support your specific business goals. Are you trying to build brand awareness? Generate leads? Drive direct sales? Each objective needs its own set of KPIs.
Primary vs. Secondary KPIs
Think of email marketing KPIs as two sides of the same coin: primary and secondary metrics. Primary KPIs are like the main course—they directly reflect your core business goals. Secondary KPIs are the side dishes—they give you extra context and help you refine your approach.
To help visualize this, let's look at a comparison table:
To help visualize this, let's look at a comparison table:
KPI Type | Primary KPIs | Secondary KPIs | Business Impact |
|---|---|---|---|
Sales Focused | Revenue Per Email, Conversion Rate | Click-Through Rate, Open Rate | Measures direct impact on sales and revenue growth. |
Engagement Focused | Click-Through Rate, List Growth Rate | Open Rate, Forwarding Rate | Measures audience interaction and list health. |
Customer Retention Focused | Customer Lifetime Value, Churn Rate | Unsubscribe Rate, Complaint Rate | Measures customer loyalty and long-term value. |
This table illustrates how primary KPIs directly connect to your business objectives, while secondary KPIs offer supporting information. For a sales-focused strategy, revenue and conversions are key. If you're focused on engagement, click-through and list growth take center stage. For customer retention, you'll prioritize customer lifetime value and churn rate.
By understanding how these metrics work together, you can gain a more complete understanding of your email marketing performance. This allows you to make informed decisions based on real data, leading to tangible results.
Open Rates: What Your First Impression Really Reveals
Think of your email open rate as the first handshake in a conversation. It’s that initial impression, setting the tone for everything that follows. As a fundamental email marketing KPI, understanding its nuances is crucial, especially with recent privacy updates and shifting benchmarks. A high open rate isn't a guaranteed win, and a lower one doesn't necessarily spell disaster. Let’s explore what open rates really tell us and how to use them effectively.
Decoding the Open Rate
Imagine sending 100 emails. If 25 are opened, your open rate is 25%. Seems straightforward, right? But this metric is influenced by many things, from the allure of your subject line to whether your email even lands in the inbox. A low open rate might not mean your content is lacking; it could simply be struggling to reach its destination. For instance, problems with your sender reputation or getting caught in spam filters can drastically impact how many people actually see your email.
Furthermore, changes in email client privacy settings have added a layer of complexity to open rate tracking. Some providers now pre-fetch images, which can artificially inflate open rates. This makes it even more important to look beyond that single percentage and consider it alongside other email marketing KPIs.
Benchmarks and Interpretation
So, what constitutes a “good” open rate? Open rate is one of the most closely watched email marketing KPIs worldwide. According to Mailchimp, average open rates typically hover between 20% and 30%. However, this fluctuates depending on your industry and audience. Nonprofits, for example, often see open rates above 30%, while retail might be closer to 20%. Your open rate reflects both how enticing your subject line is and how relevant your content is to the recipient. A sudden dip could indicate deliverability issues, list fatigue, or weak subject lines. Using segmentation and personalization can often significantly improve open rates, sometimes by as much as 10 percentage points.
This screenshot from Mailchimp shows average open rates across different industries. Notice how they vary—government, hobbies, daily deals—each sector has its own norms. This underscores the importance of comparing your performance to relevant industry benchmarks. Discover more insights about email marketing benchmarks.
Optimizing for Opens
Boosting your open rate requires a multifaceted approach. Crafting compelling subject lines is paramount. Treat your subject line like a headline—it needs to grab attention and pique interest. A/B testing different subject lines can uncover what truly resonates with your audience. Don’t forget about your sender name and preheader text—these elements can further encourage opens. Preheader text is that snippet of text appearing after the subject line in many email clients. Use it strategically to add context and entice recipients to open your message.
Click-Through Rates: Where Interest Becomes Intent

Think of your email marketing campaign as a conversation. Open rates tell you how many people decided to listen in, but click-through rates (CTR) tell you how many people were really engaged and wanted to learn more. It's the moment a reader moves from passive observation to active participation. CTR reveals genuine interest and signifies the recipient’s desire to explore further. This makes it a powerful indicator of buying intent and a crucial email marketing KPI.
Understanding the Power of Clicks
Imagine your email is a storefront. Open rates tell you how many people glanced in the window, but click-through rates tell you how many actually stepped inside. This is why CTR is one of the most valuable email marketing KPIs for predicting future conversions and gauging your overall campaign success. A high CTR suggests your message resonates with your audience. A low CTR, on the other hand, might suggest you need to tweak your message or calls to action.
Click-through rate is calculated by dividing the number of unique clicks by the number of delivered emails, then multiplying by 100. This simple calculation gives you a powerful percentage that reflects how well your email content motivates action. CTR provides direct insight into the effectiveness of your email’s core message and how strong your calls to action are.
Benchmarks and What They Reveal
So, what constitutes a good click-through rate? Generally, a healthy CTR hovers around 3% to 5% for most industries. Truly high-performing campaigns often exceed 6%. Click-through rate is a pivotal email marketing KPI that reveals the effectiveness of your content and how compelling your calls to action are. Remember, each click signifies a step towards engagement, often making CTR more valuable than open rates for driving traffic and leads.
Let's look at a real-world example. In 2024, marketing agencies noticed that educational content tends to have higher CTRs than purely promotional emails. Conversely, emails with unclear calls to action often see CTRs below 1%, signaling a need for optimization. A/B testing, a powerful tool offered by platforms like Mailchimp, can boost CTR by 20% or more in major markets like North America and Europe. This makes it a key focus for marketers and highlights the value of data-driven optimization. Discover more insights about email marketing KPIs. You might be interested in: Effective Cold Email Examples to Boost Your Outreach.
To give you a more concrete understanding of industry benchmarks, let’s take a look at the following table:
Click-Through Rate Benchmarks by Industry Industry-specific CTR benchmarks and optimization strategies showing what good performance looks like across different sectors
Industry | Average CTR | Good CTR | Excellent CTR | Key Optimization Tips |
|---|---|---|---|---|
E-commerce | 2.5% | 4% | 6% | Personalize product recommendations, offer exclusive discounts, create urgency |
SaaS | 2% | 3.5% | 5% | Focus on value proposition, highlight new features, use strong calls to action |
Media & Publishing | 3% | 5% | 7% | Curate engaging content, optimize subject lines for clickability, personalize newsletters |
Non-profit | 1.5% | 2.5% | 4% | Tell compelling stories, highlight impact of donations, use emotional appeals |
This table provides a general overview; individual results can vary based on numerous factors, including audience segmentation, email list quality, and overall campaign strategy. However, it serves as a useful starting point for understanding where your CTR should ideally fall.
Driving Clicks Through Strategic Design
Optimizing your emails for clicks involves thoughtful design and strategy. Think about the placement of your call-to-action buttons. Are they easy to spot and click on both a computer and a mobile phone? Is the button text compelling and action-oriented? Does the body of your email naturally lead the reader towards the desired action? By carefully considering these elements, you can dramatically improve your click-through performance.
Revenue Metrics: Connecting Emails To Bottom-Line Results
Revenue metrics are the true test of any email marketer. They distinguish between those who generate real business results and those just managing an inbox. This is where your email marketing KPIs truly shine, connecting campaign performance directly to your bottom line.
Measuring The Monetary Impact Of Your Emails
Think of Revenue Per Email (RPE) as the average earning power of a single email sent. It’s a simple yet effective metric, calculated by dividing your total email revenue by the number of emails successfully delivered.
For example, if a campaign earns $1,000 from 10,000 delivered emails, the RPE is $0.10. This quick snapshot shows you how effectively your emails are generating revenue, helping you spot high-performing campaigns and areas needing a little extra attention.
Another key metric is Customer Lifetime Value (CLTV). This represents the total revenue you can expect from a single customer throughout their entire relationship with your business.
Imagine a customer spends an average of $50 per month and stays subscribed to your emails for two years. Their CLTV would be $1,200. Understanding CLTV helps you focus on your most valuable customers and make smart decisions about acquiring and keeping them. You might be interested in: Effective Outbound Lead Generation Strategies That Convert.
Attribution: Giving Credit Where Credit Is Due
In today's multi-channel marketing world, accurately attributing revenue to email can be a bit like untangling a knot. Imagine a customer clicks an email, browses your website, and then a week later buys something after seeing a social media ad. Which channel gets the credit for the sale? That's where attribution models step in.
These models assign a value to each interaction a customer has with your business. For example, a last-click attribution model gives all the credit to that social media ad. But a first-click attribution model would give the credit to that initial email click. Choosing the right attribution model depends on your unique business and marketing goals.
This screenshot shows a sample Google Analytics dashboard. See how it breaks down traffic sources and conversions? This helps you visualize which channels contribute the most to your revenue and understand the role email plays alongside other marketing efforts.
Optimizing Email For Revenue, Not Just Engagement
Maximizing email revenue is about more than just high open and click-through rates. It needs a strategic approach focused on converting leads into paying customers.
This means identifying high-value segments within your email list and crafting targeted campaigns that speak directly to their needs and interests. For example, sending personalized product recommendations based on past purchases can significantly boost average order values.
Building automated email sequences that nurture leads and encourage repeat purchases is another powerful way to drive long-term revenue growth. By optimizing for revenue at every stage of the customer journey, you can turn your email program into a revenue powerhouse.
List Health: Building An Audience That Actually Engages

This screenshot from Mailchimp gives you a peek into a platform built for managing email marketing campaigns. Notice how the design highlights list management and campaign creation—a visual reminder of how vital a healthy email list truly is. Think of your email list as the bedrock of your email marketing efforts. All your other key performance indicators (KPIs) rely on it.
It's not about chasing huge subscriber numbers, but about the quality of those subscribers. A massive list packed with unengaged contacts can actually hurt your email marketing.
A smaller, enthusiastic audience will nearly always outperform a larger, inactive one. Imagine a garden: a small patch of flourishing plants is far more valuable than acres of weeds. That's why prioritizing list health is so important for sustainable email marketing success.
Understanding List Decay and Its Impact on Email Marketing KPIs
List decay is the natural decline of your email list over time. People switch email addresses, their interests shift, or they simply forget they signed up. This directly impacts your email marketing KPIs, especially open rates and click-through rates.
Sending emails to inactive addresses increases your bounce rate, which can damage your sender reputation. A high percentage of unengaged subscribers also pulls down your overall open and click-through rates, making your campaigns seem less effective than they are.
Strategies for Maintaining a Healthy and Engaged Email List
So, how do you fight list decay and keep your audience engaged? First, establish a solid list hygiene routine. Regularly remove inactive subscribers or those who consistently ignore your emails.
Next, segment your list based on engagement. This allows you to personalize content and send targeted re-engagement campaigns to win back inactive subscribers. Try offering exclusive content, discounts, or simply asking for feedback.
Think about a lead generation strategy for your email list. You might find this helpful: Lead Generation for SaaS: Your Complete Growth Playbook. Focus on attracting truly interested potential customers instead of just aiming for high subscriber counts. This means providing valuable lead magnets, using double opt-in confirmation, and being clear about the benefits of subscribing.
Finally, consider using an engagement scoring system. Award points for different actions like opening emails, clicking links, and visiting your website. This helps you identify your most engaged subscribers and anticipate future behavior.
By focusing on these strategies, you'll cultivate a responsive, valuable audience that consistently performs well across all your email marketing KPIs.
Advanced Analytics: Turning Data Into Strategic Advantage
Moving beyond simple email metrics like opens and clicks, let's explore how the pros use advanced analytics to truly sharpen their email marketing strategies. This is about transforming raw data into usable business intelligence. It's not just about collecting numbers – it’s about understanding the story those numbers tell.
Cohort Analysis: Unveiling Hidden Patterns in Your Email Data
Think of cohort analysis like grouping your subscribers based on when they joined your email list and then observing their behavior over time. Imagine tracking two groups: one that subscribed in January and another in February. By comparing their opens, clicks, and purchases over several months, you see how each group interacts with your emails over time. This unveils insights into how long it takes different groups to make a purchase and which group becomes more valuable in the long run. You might discover, for example, that the February group spends more on average after six months. This granular view lets you fine-tune your email campaigns for better targeting.
Predictive Modeling: Anticipating Future Subscriber Behavior
Predictive modeling uses your existing email data to anticipate future subscriber actions. Think of it like predicting which subscribers are about to unsubscribe. By analyzing past behavior like infrequent opens and clicks, you can spot the warning signs of disengagement. This lets you launch targeted re-engagement campaigns, such as offering an exclusive discount to those at risk, enticing them to stay connected with your brand. This proactive approach helps maintain a healthy subscriber list.
Advanced Segmentation: Targeting Your Most Valuable Customers
Advanced segmentation takes you beyond basic demographics. It allows you to divide your email list based on actual engagement patterns. Imagine segmenting your subscribers based on their purchase history. You could create specific segments for high-value customers, frequent buyers, and those who haven't purchased recently. This detailed segmentation empowers you to create tailored email content for each group. For instance, high-value customers might receive sneak peeks at new products, while those who haven't purchased in a while could receive personalized recommendations or special discounts. This strategic approach boosts relevance and drives conversions.
This screenshot shows a data visualization example from Google Analytics. Notice how it displays various metrics and dimensions, providing a comprehensive overview of website traffic sources. This visual representation helps identify your top-performing channels and understand the role email plays in driving website engagement.
Building a Data-Driven Email Marketing Program
Custom dashboards and automated alerts bring your email marketing to the next level. Imagine setting up an alert that notifies you when open rates dip below a certain level. This helps you quickly identify and address potential deliverability problems. Combining email KPIs with your broader marketing data provides a holistic view of your performance. Multi-variate testing, such as testing different subject lines, calls to action, and email designs simultaneously, accelerates the optimization process. This data-driven approach empowers you to make informed decisions and secure resources for program growth.
Let's look at some ways to calculate these key email marketing metrics. The following table provides formulas and examples to help you understand the mechanics behind the numbers.
KPI Name | Formula | Example Calculation | What It Measures |
|---|---|---|---|
Open Rate | (Emails Opened / Emails Delivered) * 100 | (500 Opened / 1000 Delivered) * 100 = 50% | Percentage of recipients who opened your email |
Click-Through Rate (CTR) | (Unique Clicks / Emails Delivered) * 100 | (100 Clicks / 1000 Delivered) * 100 = 10% | Percentage of recipients who clicked a link in your email |
Conversion Rate | (Conversions / Emails Delivered) * 100 | (20 Conversions / 1000 Delivered) * 100 = 2% | Percentage of recipients who completed a desired action (e.g., purchase) |
Unsubscribe Rate | (Unsubscribes / Emails Delivered) * 100 | (10 Unsubscribes / 1000 Delivered) * 100 = 1% | Percentage of recipients who unsubscribed from your email list |
Bounce Rate | (Bounced Emails / Emails Sent) * 100 | (50 Bounced / 1000 Sent) * 100 = 5% | Percentage of emails that were not delivered |
This table summarizes the key calculations for important email marketing KPIs. By understanding these formulas, you can effectively track your email performance and identify areas for improvement. Remember, analyzing these metrics regularly is key to optimizing your email strategy and achieving your marketing goals.
Your Email Marketing KPI Success Blueprint
Success with email marketing KPIs isn't about tracking everything. It's about focusing on the metrics that genuinely matter to your business. It's about creating processes that turn data into real, measurable growth. This guide offers a practical framework you can use right away, no matter your level of experience.
Building Your KPI Framework: A Step-by-Step Guide
Think of your email marketing KPIs like the instruments on an airplane's dashboard. Each dial and gauge gives the pilot critical information, guiding them to a safe landing. Your KPIs provide a similar real-time view of your email program, helping you navigate towards your business goals.
So, how do you build this framework? Let's break it down:
Define Your Objectives: What are you hoping to achieve with email marketing? Are you trying to build brand awareness? Generate more leads? Boost sales? Your objectives will shape which KPIs are most important.
Prioritize Your Metrics: Not all KPIs are created equal. Focus on the primary KPIs that directly reflect your core objectives. For example, if your strategy centers on sales, then revenue per email and conversion rate are key. If you're prioritizing engagement, then click-through rate and list growth rate become more important.
Establish Realistic Benchmarks: Industry benchmarks offer a helpful starting point. However, your specific benchmarks should reflect your own past performance, business model, and target audience. A 25% open rate might be fantastic for one industry, but just average for another. For further insights, check out our email marketing articles.
Create Accountability Systems: Regularly review your KPIs and adjust your email strategy based on the data. This continuous monitoring and optimization is what turns insights into real results. Think of it like a feedback loop, constantly refining your approach.
Troubleshooting and Maintaining Momentum
Even with a solid KPI framework, you might run into some bumps in the road. Here are some common challenges and how to overcome them:
Plateauing or Declining Metrics: If your KPIs are flatlining or dropping, it's time to revisit your strategy. A/B test different subject lines, email content, and calls to action to see what resonates. Maybe your audience is experiencing message fatigue, or perhaps your content needs a refresh.
Implementation Challenges: Integrating new tracking tools or changing team workflows can be tricky. Start small, focusing on one change at a time. Offer training and support to your team to make sure everyone is on the same page.
Scaling Your Email Program: As your business grows, your email marketing needs to keep up. Regularly reassess your KPI framework to ensure it's still aligned with your evolving business goals. Consider adopting more advanced analytics and automation tools to streamline your processes.
Success with email marketing KPIs is an ongoing process. By building a strong measurement framework, focusing on the right metrics, and consistently optimizing based on data, you can turn your email program into a reliable engine for growth. Ready to scale your B2B lead generation with a performance-driven approach? Contact Fypion Marketing today for a free consultation and discover how our pay-per-meeting model can transform your pipeline.
Comments