
B2B Cold Email Response Rates: What Good Looks Like

Across 336,257 B2B contacts, one 2026 dataset recorded 0.84% total replies but only 0.29% positive replies, according to Reply.io’s email response analysis. That gap changes the question worth asking. A campaign can generate responses without generating enough commercial interest to justify its workload.
B2B cold email response rates are useful only when you know what was counted. Published averages mix messages, recipients, human responses, and automated replies. For a business buying qualified appointments, the more useful benchmark is qualified meetings per delivered email, supported by a funnel that explains where prospects drop out.
Cold Email Reply Rate Benchmarks at a Glance
Reply rate benchmarks for B2B cold email
| Benchmark | Reply rate | Context |
|---|---|---|
| All-platform average, 2026 | 3.43% | Instantly benchmark across billions of interactions, reported in industry summaries |
| Top 25% of campaigns | 5.5% or higher | Instantly, 2026 |
| Top 10% of campaigns | 10.7% or higher | Instantly, 2026 |
| Average across 93 business domains, 2024 | 5.8% | Belkins; down from 6.8% in 2023 |
| Campaigns under 50 recipients | 5.8% | Campaign-size comparison reported by lemlist; smaller lists |
| Campaigns over 1,000 recipients | 2.1% | Campaign-size comparison reported by lemlist; broad sends |
The Instantly figures, summarized in Ploy’s email outreach statistics, suggest an actionable starting point: roughly 3 to 4 replies per 100 is an ordinary broad-platform result, while 5 to 6 is stronger than average and 10 or more represents high-performing territory. That interpretation applies to comparable reply measurements, not positive responses or booked meetings.
The table is a collection of reference points, not a single performance ladder. Its rows represent different platforms, periods, campaign populations, and potentially different denominators. The historical and campaign-size comparisons need their own methodological context before you use them to judge a current campaign.
Compare the measurement before the number
A campaign measured per unique prospect shouldn’t be ranked directly against one measured per message sent. Likewise, a campaign counting unsubscribe requests as replies can appear stronger than one counting only human expressions of interest.
At Fypion Marketing, our broad guidance is that typical cold email reply rates can fall around 3% to 8% or higher, depending on vertical. That’s not a substitute for a matched comparison, and it doesn’t establish verified industry-specific ranges.
The available benchmark evidence doesn’t provide consistent, verified ranges for SaaS, technology, e-commerce, and other individual sectors. Rather than manufacture those ranges, use your own comparable campaign history and apply a disciplined industry benchmarking approach.
Use the table through a short check:
- Find your current rate. Write down its numerator, denominator, and exclusions.
- Locate a comparable reference. Match the measurement and campaign context before judging the result.
- Choose the next realistic tier. Treat it as a testing target, not a promised outcome.
A stronger reply benchmark is useful only if reaching it also improves the conversations your sales team wants.
What Your Reply Rate Really Counts
A reply rate is a ratio, not a self-explanatory result. Divide replies by messages sent, delivered messages, unique prospects, or completed sequences, and you’re answering different questions.
Belkins’ analysis of 16.5 million cold emails across 93 business domains reported an average reply rate of 5.8% in 2024, down from 6.8% in 2023, as summarized in SHNO’s sales email conversion statistics. That historical average is a reference point, not a guarantee for a particular offer, audience, or sending setup.
One campaign can produce several legitimate rates
Consider a sequence that contacts each prospect repeatedly. A recipient-level calculation asks how many people responded; a message-level calculation asks how many messages were required to produce those responses. Adding follow-ups increases the message denominator even when the prospect count stays unchanged.
Neither measure is automatically wrong. The mistake is presenting them under the same label and comparing them as though they were interchangeable.
It’s similar to a fishing report: bites per cast and catches per boat describe different outcomes. A reply can signal attention without showing buying interest, just as a bite doesn’t establish that anyone landed a fish.
Measurement rule: A percentage without a written denominator isn’t ready for comparison.
Define what qualifies as a response
Separate the reply categories before producing a headline figure:
- Automated messages. Out-of-office notices and system acknowledgments aren’t human engagement.
- Negative human replies. Declines and removal requests are real responses, but not evidence of demand.
- Positive replies. Interest, relevant questions, or a useful referral deserve their own classification.
- Qualified conversations and appointments. Record commercial fit separately from willingness to reply.
Bounces belong in delivery reporting, not the reply numerator. Keep automated responses available for operational handling, but exclude them from the human-response measure.
Every report should also identify the reporting period, market and audience, and campaign denominator. Without those details, a change might reflect a different audience or sequence structure rather than better execution.
Rewrite your previous reporting period’s reply rate as a complete statement: human respondents divided by unique prospects who received a message, for example. Then label which responses were automated, negative, positive, or qualified. You’ll have a more useful baseline before changing any copy.
Metrics to Track from Send to Meeting
A lower reply rate can be the better commercial result. If fewer responses lead to more qualified meetings, optimizing for total replies would push the campaign in the wrong direction.
Campaign size deserves attention alongside copy. Lemlist’s cold email response-rate analysis reports 5.8% replies for campaigns with fewer than 50 recipients, compared with 2.1% for campaigns exceeding 1,000 recipients. These are observational comparisons, not proof that reducing any list automatically improves performance.
Funnel metrics, formulas and segments
| Metric | Formula | Segment by |
|---|---|---|
| Delivery rate | Delivered emails / emails sent | Sending domain, list source |
| Total reply rate | Replies / unique prospects delivered | Market, persona, sequence step |
| Human reply rate | Human replies / delivered emails, excluding automated replies from the numerator and bounces from the denominator | Message variant |
| Positive-response rate | Positive replies / delivered emails | Segment, seniority |
| Meeting-booked rate | Meetings booked / delivered emails | Campaign size |
| Opportunity rate | Qualified opportunities / meetings booked | Offer, ICP tier |
Multiply each ratio by a hundred when expressing it as a percentage. Because this table includes both prospect-level and message-level measures, retain those labels in your dashboard rather than shortening everything to reply rate.
Read the funnel in order
Start with delivery rate. Your sending platform’s delivered status generally indicates acceptance rather than confirmed primary-inbox placement, so don’t interpret it as proof that someone saw the message.
Next, distinguish all replies from human replies. Deduplicate respondents consistently, and decide whether sequence-step reporting credits the triggering message or the prospect’s entire sequence.
Positive-response rate separates attention from potential demand. Define positive consistently: a relevant request for details may qualify, while an automatic acknowledgment doesn’t.
Meeting-booked rate connects outreach to appointments, but it still needs a quality check. Add qualified meetings divided by delivered emails as the primary outcome when appointment fit is the objective. Opportunity rate then shows how many booked meetings become opportunities under your agreed qualification rules.
Keep segments attached to outcomes
Report each stage by sending domain, sequence step, message variant, market, and persona. Otherwise, a strong aggregate can conceal a weak domain or a message that performs poorly with the decision-maker you need.
For teams combining channels, ViralBrain’s guide to LinkedIn analytics tools can help structure a separate view of social engagement. Keep that reporting distinct from email conversion, just as you’d distinguish click-through and open-rate measurements from booked appointments.
Build a six-column funnel sheet using a recent, completed campaign period. Preserve the underlying counts alongside every percentage, and annotate any differences in observation windows. A meeting that hasn’t had time to qualify shouldn’t be treated as a failed opportunity.
What Moves Your Reply Rate Most
Deliverability and list quality come before copy. If an address is invalid or a provider filters the message, the prospect can’t evaluate how relevant your offer is.
Woodpecker’s cold email statistics identify verified addresses, bounce rates below 2%, authenticated sending infrastructure, and domain warmup as prerequisites; its summary of more than 20 million emails reports roughly 7% to 9% replies with basic or absent personalization versus 17% to 18% with advanced personalization. These figures describe the summarized dataset, not a guaranteed lift from editing a message.
Drivers of cold email replies and what to check
| Driver | What to Check | Measured Effect |
|---|---|---|
| Deliverability | SPF, DKIM, and DMARC on each sending domain; Fypion uses a 21-day warmup | Operational prerequisite; no isolated reply-rate lift established |
| List quality | Verify addresses and investigate bounce patterns | Fewer messages lost to invalid addresses; no isolated lift established |
| Personalization | Connect a researched trigger to a specific problem | Basic and advanced personalization differed substantially in the cited dataset |
| Subject lines | Relevance to the prospect’s sector and role | No verified isolated effect; test within your audience |
| Timing | Send window tested per segment | No verified isolated effect; test locally |
| Sequence | Follow-up count and a clear call to action per message | No verified isolated effect; compare qualified outcomes |
Make the infrastructure testable
Check authentication status on every sending domain, not merely the company’s main domain. At Fypion Marketing, we don’t send cold email from the primary company domain; we use separate sending domains with their own authentication.
Warmup isn’t a guarantee of inbox placement. Review bounces, provider-specific problems, and sending changes alongside your email deliverability checks before attributing a weak result to the subject line.
Personalize the business hypothesis
A first-name merge field identifies the recipient. It doesn’t explain why the message belongs in that person’s inbox.
A stronger message connects an observable trigger to a plausible problem. Say a software company is recruiting implementation staff: an outreach message could ask whether onboarding workload is increasing, then connect that hypothesis to the sender’s offer. It shouldn’t claim to know the company’s internal bottleneck.
Use a prospect’s article, recent hiring, funding, or technology adoption only when it supports that connection. Decorative research adds length without clarifying relevance.
Personalization should explain why you’re contacting this person, not merely prove that you found information about them.
Treat subject lines, timing, and sequence length as test variables, not universal growth levers. A subject should accurately frame the message; a follow-up should introduce a useful reason to reconsider rather than repeat an unanswered request.
Find the weakest prerequisite first. If addresses are failing, fix verification; if human replies are mostly irrelevant, reconsider targeting and offer fit before polishing another opening sentence.
When to Narrow Your List
Broad outreach and narrow outreach solve different problems. A broad list expands coverage, while a narrow list lets you test a more specific buying hypothesis. Neither strategy should win solely because its dashboard shows more activity.
| Strategy | What it helps you evaluate | Main risk |
|---|---|---|
| Broad coverage | Whether demand exists across adjacent audiences | Aggregate activity can obscure weak commercial fit |
| Narrow micro-segment | Whether a specific role, trigger, and problem align | A promising result may not generalize beyond that group |
| Controlled expansion | Whether the next audience preserves meeting quality | Added volume can be mistaken for improved efficiency |
The decision isn’t whether a segment replies. It’s whether your team can serve those buyers, reach the appropriate role, and justify the effort required to create an opportunity.
Narrow around a buying situation
Use buying complexity, geography, seniority, and product-market fit as segmentation dimensions. Treat their effects as hypotheses to test, not assumptions about who is easy to sell to.
For example, a founder-led software company and a procurement-led enterprise may need different proof, stakeholders, and next steps. Combining them in the same campaign makes it harder to interpret objections or identify a useful message.
A practical email list segmentation process should give each group an explicit inclusion rule. Define the role, company characteristics, observable trigger, and problem your offer addresses before sourcing contacts.
If you’re considering social activity alongside email, Linkboost’s comparison of engagement versus outreach on LinkedIn offers a useful distinction between building visibility and initiating direct conversations. Don’t combine those activities into a single response metric.
Judge the next batch, not the historical average
Use marginal qualified meetings per additional batch of sends to decide whether to expand. Compare the newly added audience with the segment you already understand, rather than letting strong earlier results conceal weak expansion.
- Keep expanding when the added audience preserves qualification and acceptable acquisition effort.
- Narrow again when additional replies bring more disqualified buyers or unproductive meetings.
- Rework the offer when a well-defined audience understands the message but doesn’t recognize enough value to continue.
Scaling checkpoint: More appointments aren’t an improvement if sales must reject a larger share of them.
Set that decision rule before launch. Otherwise, the team can keep widening the list because additional sending creates something visible to report.
A Testing Framework That Lifts Qualified Meetings
A useful test produces a decision you can defend. It doesn’t need to identify the most attention-grabbing message; it needs to identify which approach creates better commercial outcomes under comparable conditions.
Use this process as an operating checklist.
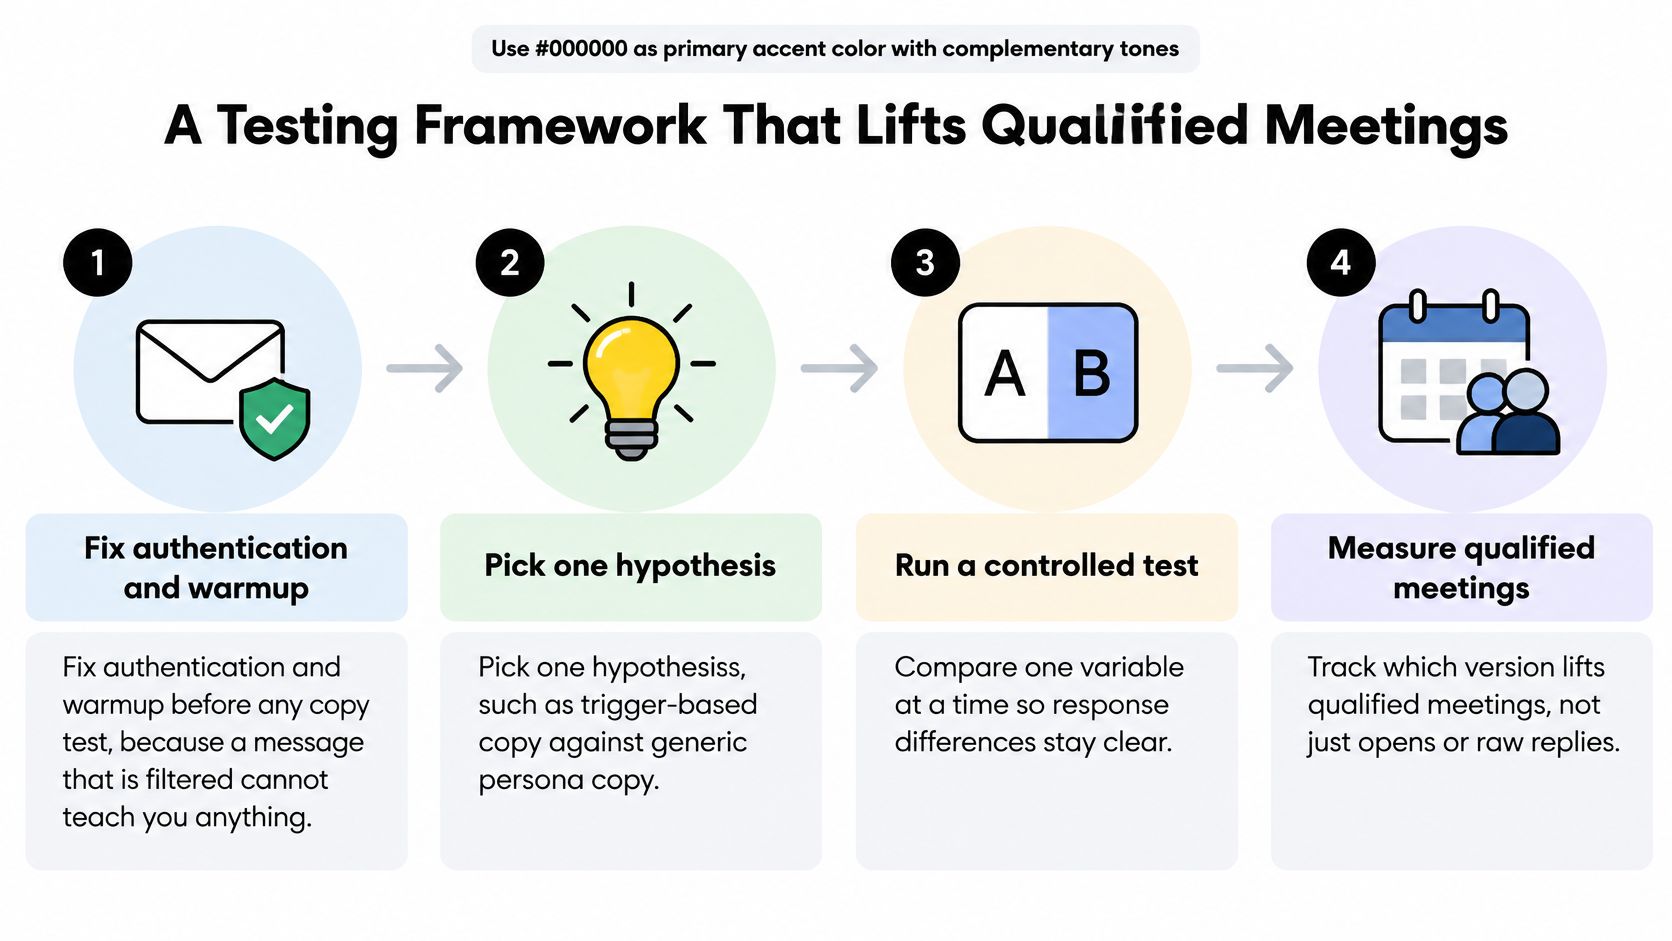
Run the experiment with explicit controls
-
Fix authentication and warmup before testing copy. Check that both variants run through comparable sending infrastructure. Testing one message on a healthy domain and another on a troubled domain confounds the comparison.
-
Choose a single hypothesis. For example, test whether a role-specific subject produces more qualified meetings than a trigger-specific subject. Changing the opener and call to action simultaneously prevents you from identifying which change mattered.
-
Hold the other conditions constant. Keep the offer, sender presentation, sequence length, and audience criteria aligned. An apparent copy winner isn’t informative if it received the stronger prospect list.
-
Balance assignment across variants and domains. Distribute comparable prospects across both versions rather than assigning each version to a different market. Check the distribution of roles and company characteristics before launch.
-
Predefine the denominator and observation window. Use delivered emails for the meeting-conversion comparison and allow both groups equal time to respond and book. Don’t declare a winner after a handful of early reactions or stop the test whenever a preferred variant leads.
-
Judge positive replies and qualified meetings. Inspect declines and removal requests separately instead of rewarding any response. A provocative subject can generate activity without improving commercial value.
-
Log the decision and its limits. Record results by persona, sequence step, and variant, then retain, revise, or retire the message. If outcomes are sparse or inconsistent, label the test inconclusive rather than converting uncertainty into a winner.
These controls make email template testing useful beyond the immediate campaign. They preserve what your team learned and prevent an unproven variation from becoming the default.
Work through a subject-line test
Say you’re contacting implementation leaders at software companies that are actively hiring. Compare a subject about implementation workload with one about onboarding capacity, while leaving the message body unchanged.
Verify infrastructure readiness, assign comparable accounts across the variants, and use the same sending schedule. Choose the observation window and qualification criteria before the first message leaves the platform.
In the test log, capture the hypothesis, audience rule, subject versions, domain assignment, delivered counts, positive responses, qualified meetings, and decision. Also record disqualification reasons: the version that attracts the wrong role shouldn’t win on response volume.
If one subject produces stronger meeting conversion but only in a particular persona, preserve that restriction. Don’t promote a segment-specific result into an account-wide rule.
For a video companion to the testing workflow:
Set Your Target From Your Own Funnel
Your most useful target starts with your own delivery, human-response, positive-response, and qualified-meeting figures. Use a consistent historical window, and separate campaigns whose targeting or measurement changed.
Place comparable reply metrics against the benchmark table, but don’t force every funnel stage into a reply-rate tier. A platform average can’t tell you what your qualified-meeting rate should be. Your qualification standard, offer, and buyer population determine what constitutes a commercially useful outcome.
Target the constraint you can identify
If positive responses don’t become meetings, investigate scheduling friction, reply handling, and the requested next step. If meetings are booked but repeatedly rejected as poor fits, tighten qualification before increasing send volume.
Set a target that names both the desired outcome and the condition you won’t sacrifice. Improving qualified meetings while preserving buyer fit is more meaningful than increasing responses without regard to their content.
A client testimonial can illustrate a reported outcome, but it shouldn’t substitute for a campaign forecast. Garrett, Founder at Recon Media, attributes 220% month-over-month growth in inbound B2B leads to Fypion Marketing’s work. That client-reported lead-growth figure isn’t a cold-email reply benchmark and doesn’t establish what another company should expect.
Match outside help to a proven offer
We work with B2B companies that have a validated offer and product-market fit. We’re not the right fit for pre-revenue startups still determining who their customer is.
Our cold email service is paid only for meetings the client confirms were a good fit. Most clients see their first meetings within two to three weeks of campaign launch, but that operating expectation isn’t a guarantee of any particular response rate or pipeline result.
Before committing more budget or sending capacity:
- Pull a consistent funnel history. Preserve counts, definitions, and qualification outcomes.
- Compare only compatible benchmarks. Use external averages to frame questions, not replace your own evidence.
- Choose one controlled test. Target the bottleneck most directly connected to qualified meetings.
The right benchmark helps you make a decision. If a percentage doesn’t tell you whether to change the list, message, infrastructure, or qualification process, it needs more context before it deserves more attention.
Fypion Marketing handles B2B prospect research, verified list building, campaign copy, and testing, with performance judged against qualified meetings rather than raw replies alone. Visit Fypion Marketing to discuss your funnel, agree on meeting-fit criteria, and identify which part of your outreach needs attention first.