Mastering Lead Gen KPIs for Business Growth
- Prince Yadav
- Jun 30, 2025
- 15 min read

Lead generation KPIs, or Key Performance Indicators, are the hard numbers that tell you if your marketing efforts are actually working. Think of them as your marketing team's report card. They cut through the noise and show you exactly how well you're attracting and turning prospects into real, potential customers.
Why Your Business Needs a GPS for Marketing
Ever tried driving cross-country without a map or a GPS? You might get there eventually, but you’ll burn through a ton of time, gas, and patience hitting dead ends and taking wrong turns. Running marketing campaigns without clear lead gen KPIs is pretty much the same thing—expensive, frustrating, and totally directionless.
These metrics turn vague goals like "get more leads" into a clear, actionable dashboard. They're your navigation system for growth, pointing out precisely what’s working and what’s just wasting money. Instead of guessing, you get to make decisions backed by solid data, which makes it a whole lot easier to justify your budget and prove you’re delivering real value.
And in today's world, this data-driven approach isn't just nice to have—it's essential. The global lead generation market was valued at around $5.59 billion in 2025 and is on track to explode to $32.1 billion by 2035. That's not just a trend; it's a massive shift in how businesses grow. You can explore the full industry trends and forecasts about lead generation market growth to see just how important this is becoming.
To start making sense of it all, it helps to group these metrics into a few core buckets.
Core Lead Generation KPI Categories at a Glance
KPI Category | What It Measures | Example Metric |
|---|---|---|
Traffic & Reach | How many people are seeing your marketing content | Website Visitors |
Conversion | How effectively you turn visitors into leads | Form Submission Rate |
Cost | The financial efficiency of your lead gen efforts | Cost Per Lead (CPL) |
Lead Quality | The value and sales-readiness of the leads you generate | Marketing Qualified Leads (MQLs) |
Revenue Impact | The direct link between marketing efforts and sales | Customer Lifetime Value (CLV) |
This table gives you a quick snapshot, but the real magic happens when you see how these numbers work together to tell a complete story about your marketing performance.
Turning Data Into Direction
The true power of KPIs is how they bring clarity and focus to your strategy. They help you pinpoint what's working and what isn't, from the big picture all the way down to a single ad or email.
The infographic below shows how these different pillars—traffic, conversion, and cost—all support your overall success.
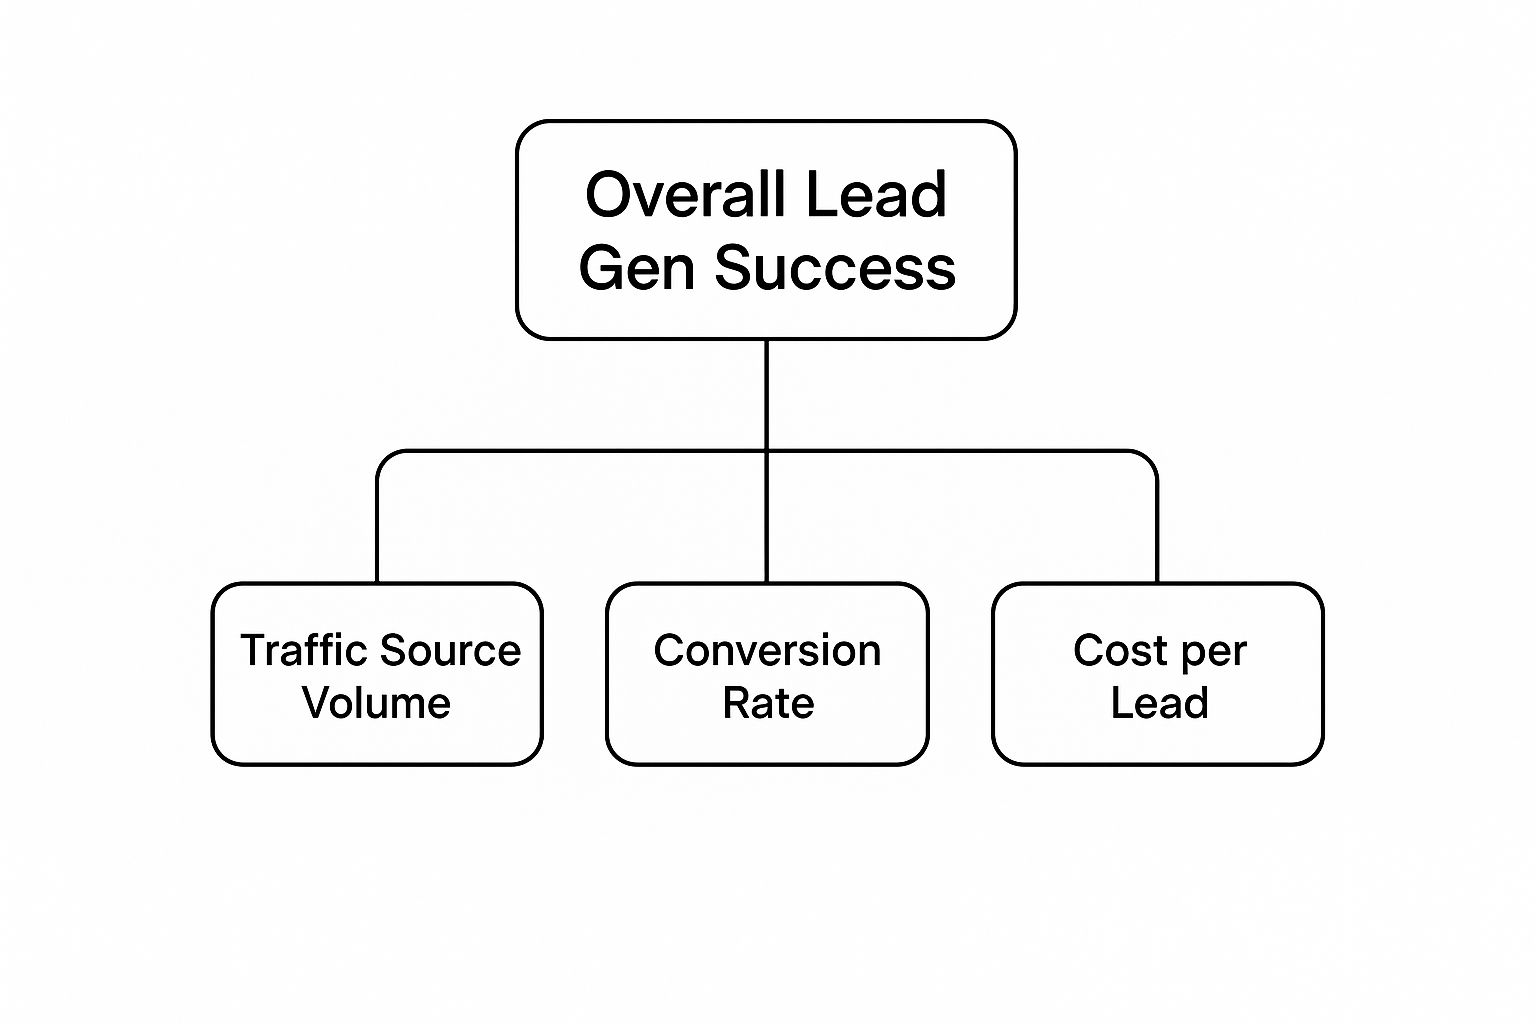
As you can see, you can't just focus on one area. Great traffic is useless without conversions, and high conversion rates don't mean much if the cost to get there is unsustainable. You have to measure and manage all three.
From Casual Browsers to Potential Buyers
Here’s a crucial truth in lead generation: not all leads are created equal. Someone who downloads your detailed pricing guide is worlds apart from someone who just liked one of your posts on social media. KPIs are your first line of defense in telling them apart.
By tracking the right metrics, you begin to see patterns in what content and channels attract the most valuable prospects, setting the foundation for a truly effective sales funnel.
This is where marketing and sales start working in perfect sync. You stop just gathering contacts and start building a predictable pipeline of future customers. It ensures your sales team spends its time on conversations that are actually likely to close. To get deeper into this, check out our guide on how lead generation KPIs can boost your marketing success.
Gauging Your Top-of-Funnel Attraction Power

Your lead generation process doesn't kick off when someone finally fills out a form. It starts way earlier, at the top of the funnel (ToFu), where the name of the game is grabbing attention and simply making people aware you exist.
Think of it like the bright, flashy sign outside a physical store. If nobody sees it or finds it interesting, they’re never going to step inside. The KPIs at this stage measure that "attraction power," telling you how well your ads, content, and brand are pulling people into your world.
If your top-of-funnel is weak, the rest of your lead generation engine will starve. Simple as that.
Let's break down the essential metrics that show how wide—and how effective—of a net you’re really casting.
Website Traffic: The First Sign of Life
At its core, Website Traffic is the most basic ToFu metric. It’s the total number of people showing up at your digital doorstep. While it might seem overly simple, this traffic is the raw material for every single lead you'll eventually generate.
But just looking at the total number is a rookie mistake. You have to dig deeper and segment the data to understand its quality. Are these visitors from your target countries? Are they coming from high-intent channels like organic search, or are they low-intent visitors from a random viral post?
Watching traffic trends over time shows the real impact of your marketing efforts. A sudden spike after launching a new blog series or ad campaign? That's a great sign your message is resonating. A slow, steady decline? That’s your early warning system screaming that your attraction strategy needs a serious refresh.
Click-Through Rate (CTR): Your Ad’s Report Card
Click-Through Rate (CTR) tells you what percentage of people saw your ad or link and were compelled enough to actually click on it. It’s a direct measure of how well your creative, copy, and offer are hitting the mark with your target audience.
CTR = (Total Clicks / Total Impressions) x 100
Imagine you're running two ads. Ad A gets a 1% CTR, but Ad B scores a 5% CTR. This isn't just about numbers; it's powerful, direct feedback from the market. It tells you the message in Ad B is five times more effective at grabbing attention.
A high CTR is a fantastic sign you've nailed your audience targeting and value prop. A low CTR, on the other hand, signals a clear disconnect. Either you're talking to the wrong people, or your message is falling flat. This feedback is gold for optimizing your campaigns and making every ad dollar work harder, a crucial part of any growth plan as we cover in our **lead generation for SaaS playbook**.
Cost Per Click (CPC): What Are You Paying for Attention?
While CTR measures your ad's effectiveness, Cost Per Click (CPC) measures its financial efficiency. This KPI shows you exactly how much you pay every single time someone clicks on one of your paid ads.
Your goal is simple: get the most qualified clicks for the lowest possible price. Your CPC is pushed and pulled by a few key factors:
Ad Quality: Platforms like Google literally reward high-quality, relevant ads with lower CPCs. They want to show good stuff to their users.
Keyword Competition: If everyone's bidding on the same popular keywords, the price goes up.
Audience Targeting: A super-specific, niche audience might have a higher CPC, but those clicks are often far more valuable and likely to convert.
Keeping a close eye on your CPC helps you manage your ad budget with precision. If your CPC on a certain channel is skyrocketing without a matching increase in lead quality, it's a huge red flag. It’s time to either rethink that channel's strategy or move that money somewhere more profitable.
Gauging Real Interest with Mid-Funnel Metrics
Getting eyeballs on your content is a great first step, but let's be honest—it doesn't pay the bills. The real test begins when a casual browser starts taking action and moves deeper into your world. This is the crucial middle-of-the-funnel (MoFu) stage, where passive interest starts hardening into real buying intent.
The lead gen KPIs you track here are less about sheer volume and more about substance. They help you tell the difference between someone who skimmed a blog post and someone who just downloaded your detailed technical whitepaper. That's a world of difference in commitment, and mastering these metrics is how you start sending your sales team actual leads, not just a list of contacts.
Conversion Rate: The Ultimate Litmus Test
If you only track one mid-funnel metric, make it your Conversion Rate. It’s the clearest indicator of how well you're turning visitors into leads. This KPI measures the percentage of people who take a specific action you want them to, like filling out a form, signing up for a webinar, or requesting a demo.
Conversion Rate = (Total Conversions / Total Visitors) x 100
A low conversion rate is a blaring alarm bell. It’s telling you something in your process is broken. Maybe the landing page is a mess, the form is way too long, or the call-to-action is just plain uninspiring.
On the flip side, a high conversion rate is proof that you’ve built a smooth, compelling journey from initial interest to concrete action. This is the metric that bridges the gap between attracting an audience and generating a lead. It’s the moment a prospect digitally raises their hand and says, "Okay, I'm listening. Tell me more."
Cost Per Lead: How Much for a Hand-Raise?
While conversion rate tells you about effectiveness, Cost Per Lead (CPL) is all about efficiency. This KPI cuts right to the chase: how much are you spending to get a single new lead? It’s a necessary reality check for your marketing budget and channel strategy.
The formula is as simple as it gets:
CPL = Total Marketing Spend / Total New Leads Generated
It’s tempting to chase the lowest CPL you can find, but that can be a trap. Sure, one channel might bring in leads for $5 a pop, but if none of them fit your ideal customer profile, you’ve just thrown that money away. Meanwhile, another channel might have a $100 CPL but consistently deliver leads that blossom into high-value, long-term customers.
The real skill is analyzing CPL in the context of lead quality. Sometimes, a higher CPL is a smart investment if it brings in better-qualified people who are more likely to buy. Finding that sweet spot between cost and quality is key to generating B2B leads that actually convert, and it's a balance every successful marketing team has to master.
The Big Leap: From Lead to MQL
Not all leads are created equal. This is where the vital distinction between a standard "Lead" and a Marketing Qualified Lead (MQL) comes into play. A lead is basically anyone who's given you their contact info. An MQL, however, is a lead who’s been properly vetted and shows signs they're a good fit and are inching closer to a purchase.
Defining what makes an MQL is a foundational step, and it requires a firm handshake between your marketing and sales teams. You have to agree on what a "good" lead actually looks like. The criteria often include:
Demographics: Job title, industry, company size.
Firmographics: Geographic location, annual revenue.
Behavior: Visited the pricing page, downloaded a case study, or attended a product webinar.
This qualification process is how you separate the signal from the noise. The percentage of your total leads that check these boxes is your Lead-to-MQL Rate. Industry benchmarks often put this rate somewhere between 5% and 15%, which just goes to show how many initial contacts don't quite make the cut for a sales conversation.
Tracking this number tells you how well your top-of-funnel activities are attracting the right kind of people. It’s how you ensure marketing is delivering real value that your sales team can run with.
Let's be honest. All the clicks, opens, and website visits in the world don't mean much until they start turning into actual revenue. This is where the rubber meets the road—where your marketing efforts finally prove their worth in dollars and cents.
The bottom of the funnel is where the most critical lead gen KPIs live. These are the metrics that bridge the gap between your marketing activities and real business outcomes. Forget the vanity metrics; these are the numbers your CEO and CFO actually care about. They cut through the marketing jargon and speak the universal language of business: revenue, cost, and profitability.
The Sales-Ready Signal: Sales Qualified Leads (SQL)
So, what exactly is a Sales Qualified Lead (SQL)? Think of it as a prospect who has raised their hand and said, "I'm ready to talk." They've been vetted by both marketing and sales and are officially deemed ready for a direct conversation with a salesperson.
This isn't just someone who downloaded an ebook. An SQL is a lead showing strong signs of wanting to buy, and they fit your ideal customer profile to a T. They might have requested a demo, asked for a price quote, or had an initial discovery call where they confirmed their budget, authority, need, and timeline (often called the BANT criteria).
Measuring the Hand-Off: MQL-to-SQL Rate
The MQL-to-SQL Rate is a crucial health check for your sales and marketing alignment. It shows you what percentage of your Marketing Qualified Leads (MQLs) are actually accepted by the sales team as legitimate, sales-ready opportunities.
MQL-to-SQL Rate = (Total SQLs / Total MQLs) x 100
A low MQL-to-SQL rate is a massive red flag. It’s a clear sign of a disconnect, usually meaning marketing is tossing leads over the fence that sales considers junk. This wastes everyone's time and creates friction. While industry averages hover between 13% and 27%, a healthy rate proves both teams are on the same page about what a "good lead" really looks like.
One of the best ways to improve this is by getting serious about lead scoring. In fact, we wrote a whole guide on how to [master B2B lead scoring to boost sales effectiveness](https://www.fypionmarketing.com/post/master-b2b-lead-scoring-to-boost-sales-effectiveness).
The Price of a New Customer: Customer Acquisition Cost (CAC)
Customer Acquisition Cost (CAC) is easily one of the most important numbers for any business. It tells you the total cost of all your sales and marketing efforts needed to land a single new customer. Don't think of it as just an expense—it's a strategic investment.
The calculation is pretty straightforward:
CAC = (Total Sales & Marketing Costs) / (Number of New Customers)
A lower CAC is great, but it needs context. For example, spending $5,000 to acquire a customer who will only ever pay you $1,000 is a recipe for disaster. This is why our next metric is so vital.
The Long-Term View: Customer Lifetime Value (CLV)
This is the big one. Customer Lifetime Value (CLV) estimates the total revenue you can expect to earn from a single customer over the entire course of their relationship with your business. It forces you to shift your focus from a single sale to long-term profitability and retention.
Understanding your CLV is what allows you to make smart decisions about your CAC. It tells you exactly how much you can afford to spend to get a new customer in the door. For a business to be healthy, the math is simple: your CLV must be higher than your CAC.
A solid benchmark to aim for is a CLV to CAC ratio of 3:1 or better. This means for every dollar you invest in acquiring a customer, you're getting at least three dollars back over their lifetime. When you hit that ratio, you've proven your lead generation engine isn't just busy—it's building a sustainable, scalable, and profitable business.
Lead Gen KPI Benchmarks by Funnel Stage
It's always helpful to see how your numbers stack up against the competition. While every industry is different, these benchmarks provide a general sense of what "good" looks like at each stage of the funnel. Use this table to spot potential weak spots in your own strategy.
Funnel Stage | KPI | Industry Average Benchmark |
|---|---|---|
Top of Funnel (TOFU) | Cost Per Lead (CPL) | $30 - $250+ (Varies widely by industry) |
Top of Funnel (TOFU) | Click-Through Rate (CTR) | 2% - 5% (For search and social ads) |
Middle of Funnel (MOFU) | Conversion Rate | 1% - 3% (For landing pages and forms) |
Middle of Funnel (MOFU) | Marketing Qualified Lead (MQL) Rate | 10% - 20% (Of total leads) |
Bottom of Funnel (BOFU) | MQL-to-SQL Rate | 13% - 27% |
Bottom of Funnel (BOFU) | CLV:CAC Ratio | 3:1 or higher |
Remember, these are just averages. The goal isn't just to meet the benchmark, but to understand what drives these numbers for your business and continuously work to improve them. A deep understanding of these KPIs is what separates the marketers who just run campaigns from those who drive real growth.
Turning Your Data into a Competitive Advantage
Let's be honest, collecting data is the easy part. Every click, download, and form submission just adds another drop to the ocean. The real magic—and where the money is made—is turning all that raw information into a growth engine for your business.
Tracking your lead gen KPIs shouldn’t just be a box-ticking exercise you do at the end of the month. It needs to be an active, ongoing process. This is how you go from staring at a dashboard to making strategic moves that give you a real competitive edge. You're essentially creating a feedback loop: test, learn, and refine. Your marketing gets smarter and more profitable over time.
This hands-on approach is what separates the winners from everyone else. In fact, businesses that really lean into data-driven lead generation see a 5 to 8 times higher ROI than those who don't. That’s a huge performance gap, and it shows you just how powerful it is to let your KPIs guide your decisions. You can read more about the impact of analytics-based lead generation strategies on uplead.com.
From Reporting to Actionable Insights
First things first: stop looking at your KPIs in a vacuum. A low Cost Per Lead (CPL) looks great on the surface, but what if those cheap leads are duds that never convert? You’ve got to connect the dots between your metrics to get the full picture.
Here’s a classic example. You notice one of your marketing channels has a fantastic CPL of just $20, while another is way up at $150. The knee-jerk reaction? Pour more cash into the cheap channel, right?
But then you dig deeper. You find that the $20 leads have a dismal 1% MQL-to-SQL rate. Meanwhile, the "expensive" $150 leads are converting to SQLs at a healthy 25% clip.
This insight flips your strategy on its head. That "expensive" channel is actually where the real money is, and it deserves more budget. You’d completely miss this if you weren't connecting your KPIs.
Implementing a Data-Driven Optimization Cycle
Turning data into growth isn't about guesswork; it's about having a system.
Here are a few practical ways to put your data to work:
Implement Lead Scoring: This is a game-changer. Set up a system that gives points to leads based on who they are (job title, company size) and what they do (visit your pricing page, download a whitepaper). This lets your sales team immediately focus on the hottest leads, making them way more efficient.
A/B Test Everything: Don't just assume you know what works. Constantly run A/B tests on your landing pages, ad copy, and calls-to-action. Test one thing at a time—the headline, the button color, the offer—and let the data tell you which version is the winner.
Reallocate Budget Dynamically: Your marketing budget shouldn't be carved in stone. Keep a close eye on your Lead Cost by Channel and Customer Acquisition Cost (CAC) every month or quarter. Be ready to shift funds away from channels that aren’t pulling their weight and double down on the ones that are bringing in profitable customers.
By treating your KPI dashboard as a playbook rather than a report card, you empower your team to diagnose problems and prescribe the right fix. You stop spending money and start investing it.
This shift in mindset transforms your marketing from a simple cost center into a predictable, scalable revenue machine. It's how you make sure every single dollar you spend is working as hard as possible to grow your business.
Frequently Asked Questions About Lead Gen KPIs
Even after you've got a handle on the main metrics, a few questions always seem to pop up. Let's be honest, the world of lead gen KPIs can feel a bit tangled, with terms that sound suspiciously similar and rules that change depending on the context.
This section is here to clear the air. We'll tackle the most common points of confusion head-on with direct, no-fluff answers so you can get back to what actually matters—growing your business.
What Is the Difference Between a Metric and a KPI?
This is easily one of the most common questions, and the distinction is critical if you want to stay focused on what truly moves the needle.
Think about your car's dashboard. It's filled with data points: the current radio station, the outside temperature, your exact RPMs. These are all metrics—they're just raw measurements of something.
But the numbers you actually rely on to get to your destination safely and on time are your speed, your fuel level, and maybe your engine temperature. These are your KPIs, or Key Performance Indicators. They aren't just any old numbers; they're the specific metrics you've hand-picked because they directly track your progress toward a critical goal (in this case, a successful trip).
In marketing, "social media likes" is a metric. But the "conversion rate" from a link in that same post is a KPI. Why? Because it directly measures your progress toward the business goal of actually generating a lead. All KPIs are metrics, but only the most important metrics get to be called KPIs.
How Often Should I Review My Lead Gen KPIs?
The right answer depends entirely on the metric itself. You wouldn't check your car's fuel level every five seconds, but you also wouldn't wait three hours into a road trip to check it for the first time.
You need to apply that same logic to your KPIs. I find it helpful to group them into two buckets:
Fast Metrics (Daily/Weekly Review): These are your immediate, top-of-funnel signals like Cost Per Click (CPC), Click-Through Rate (CTR), and daily ad spend. When you're running an active campaign, you need to watch these closely. Checking them daily or weekly allows you to make quick, tactical tweaks to get the best performance.
Slow Metrics (Monthly/Quarterly Review): These are the deeper, more strategic KPIs that tell a bigger story—things like Cost Per Lead (CPL), Customer Acquisition Cost (CAC), and your MQL-to-SQL Rate. These metrics simply need more time and data to be meaningful. They reflect the impact of your broader strategy, not just a single ad.
Which KPI Is the Most Important for My Business?
This is a trick question. The only right answer is: it depends on your primary business goal. There's no single "holy grail" KPI that works for every company, all the time. The most important KPI is contextual and should change as your company's priorities change.
For example:
A brand-new startup trying to grab market share as quickly as possible will likely live and die by its Customer Acquisition Cost (CAC), making sure growth is efficient.
An established company focusing on long-term health will probably obsess over the Customer Lifetime Value (CLV) to CAC ratio, ensuring every new customer is a profitable investment.
Ultimately, your most important KPI is whichever one gives you the clearest, most honest measure of success against your company's current #1 objective.
One of the best ways to figure out which leads are most valuable—and therefore which KPIs to focus on—is to have a rock-solid qualification process. If you need help with that, check out our **sales lead qualification checklist for B2B success**, which breaks down seven criteria for spotting the best prospects.
Ready to stop guessing and start getting qualified meetings on your calendar? At Fypion Marketing, we specialize in performance-based B2B lead generation. You don't pay retainers or setup fees—you only pay for qualified meetings that meet your criteria. Scale your pipeline predictably with Fypion Marketing today.
Comments