Lead Generation KPIs: Boost Your Marketing Success in 2025
- Prince Yadav
- Jun 14, 2025
- 14 min read

Unlocking Growth: Essential Lead Generation KPIs for 2025
In the competitive market of 2025, effectively tracking your lead generation KPIs is crucial for sustainable growth. This listicle provides in-depth descriptions of seven essential metrics you need to monitor to optimize your lead generation strategies and maximize ROI. We'll cover definitions, calculations, benchmarks, and optimization tips for each KPI. This knowledge empowers you to refine campaigns, accelerate growth, and achieve your business objectives.
This article focuses on providing actionable insights for B2B businesses, SaaS companies, tech startups, and e-commerce brands seeking scalable lead acquisition, especially those utilizing performance-based models like pay-per-meeting. Whether you're managing in-house campaigns or outsourcing lead generation efforts, understanding these key metrics is essential for success.
We'll equip you to answer critical questions like:
What is a good cost per lead for my industry?
How can I improve my lead conversion rates?
Which lead sources are most effective?
How long does it take to convert a lead into a customer?
By mastering these lead generation KPIs, you can make data-driven decisions, identify areas for improvement, and ultimately achieve greater success in acquiring and converting high-quality leads. This deep dive will explore:
Lead Conversion Rate
Cost Per Lead (CPL)
Lead Quality Score
Lead Volume
Lead to Customer Conversion Rate
Time to Conversion
Lead Source Attribution
Each KPI offers unique insights into the effectiveness of your lead generation efforts. By analyzing these metrics, you can optimize your strategies and achieve sustainable growth. Let's dive in.
1. Lead Conversion Rate
Lead conversion rate is a cornerstone lead generation KPI that reveals the effectiveness of your marketing efforts in turning visitors or prospects into qualified leads. It measures the percentage of your total audience who complete a desired action, such as filling out a form, downloading a resource, or signing up for a trial. This metric provides valuable insights into how well your strategies are attracting and converting potential customers. Understanding and optimizing your lead conversion rate is crucial for maximizing your return on investment and achieving sustainable growth.
Calculating Lead Conversion Rate
Calculating your lead conversion rate is straightforward:
(Number of New Leads / Total Number of Visitors) * 100 = Lead Conversion Rate
For example, if you had 1,000 website visitors and generated 25 new leads, your lead conversion rate would be 2.5%. This seemingly small percentage can have a significant impact on your overall business performance.
Industry Benchmarks and Examples
Understanding industry averages helps contextualize your own performance. HubSpot reports an average landing page conversion rate of 2.35%, while Unbounce found that top-performing landing pages achieve 11.45%. B2B companies typically experience website conversion rates between 2-3%. To better visualize these benchmarks, consider the following chart:
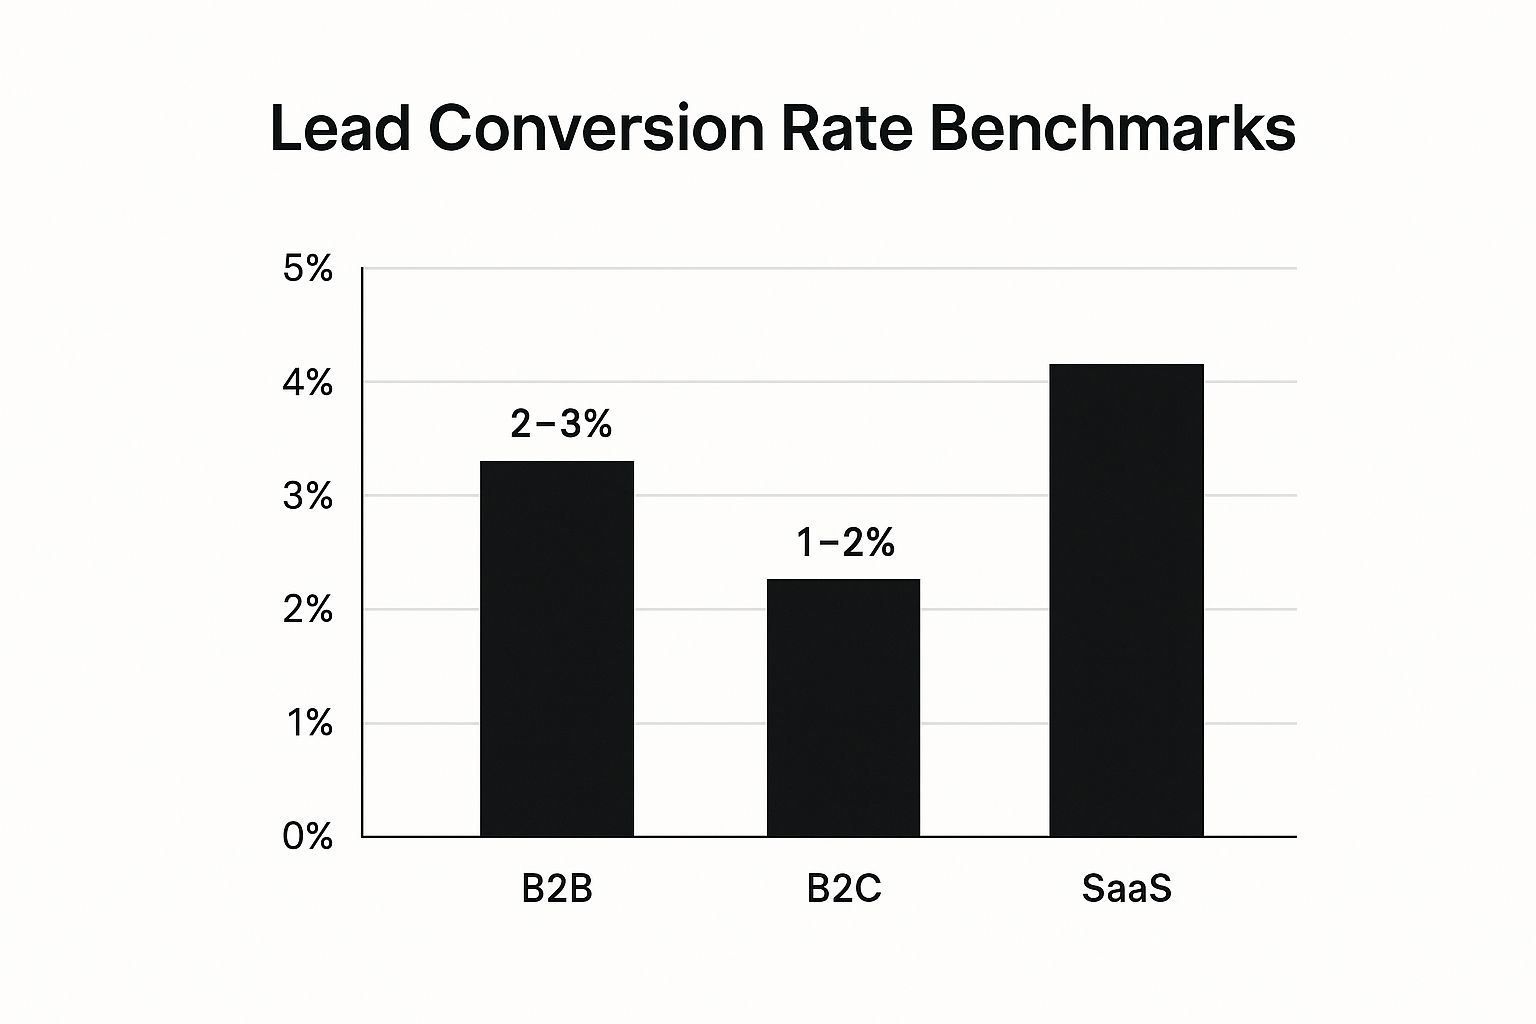
This bar chart, "Lead Conversion Rate Benchmarks," compares average lead conversion rates across B2B, B2C, and SaaS industries. The chart highlights that SaaS companies tend to have slightly higher conversion rates (3-5%) compared to B2B (2-3%) and B2C (1-2%). This difference likely stems from SaaS offerings often involving free trials or freemium models, making the initial conversion less of a commitment for potential customers.
Optimizing Your Lead Conversion Rate
Improving your lead conversion rate requires a strategic approach. Here are several actionable tips:
A/B test different form lengths and placements: Experiment with shorter forms and various placements on your website to identify what resonates best with your audience.
Use compelling call-to-action buttons: Implement clear, action-oriented language on your call-to-action buttons to encourage conversions. For instance, instead of "Submit," use phrases like "Get My Free Trial" or "Download Now."
Implement progressive profiling: Reduce form friction by gradually collecting information from leads over time, rather than asking for everything upfront.
Track conversions by traffic source: Analyze which sources are driving the most qualified leads to optimize budget allocation and focus on high-performing channels. Understanding which channels yield higher conversion rates can significantly impact your overall lead generation strategy. You might find, for instance, that traffic from organic search converts at a higher rate than traffic from paid social media campaigns.
Monitoring email marketing KPIs can also provide valuable insights into lead nurturing and conversion optimization. Learn more about lead conversion rate and other email marketing KPIs that actually drive business growth. By continuously analyzing and refining your strategies, you can significantly improve your lead conversion rate and drive business growth.
2. Cost Per Lead (CPL)
Cost Per Lead (CPL) is a crucial financial lead generation KPI that measures the average amount spent on acquiring a single lead through marketing efforts. This metric helps businesses understand the efficiency of their lead generation investments across various channels and campaigns. By analyzing CPL, companies can optimize their spending and maximize their return on investment. Understanding CPL is essential for making informed decisions about budget allocation and campaign effectiveness.
Calculating Cost Per Lead
Calculating CPL is straightforward:
Total Marketing Spend / Number of Leads Generated = CPL
For example, if you spent $1,000 on a marketing campaign and generated 50 leads, your CPL would be $20. This means each lead acquired through that specific campaign cost you $20.
Industry Benchmarks and Examples
CPL benchmarks vary significantly across industries and channels. Understanding these averages helps contextualize your own performance. For B2B companies, LinkedIn ads average around $75 CPL, while Google Ads typically range from $50-$100. Content marketing can achieve a lower CPL, often around $31, and email marketing frequently delivers under $10. These variations highlight the importance of choosing the right channels for your target audience and business goals.
Optimizing Your Cost Per Lead
Reducing your CPL involves a strategic approach focused on maximizing efficiency and effectiveness:
Track CPL by channel and campaign: Gain granular insights into which channels and campaigns are most cost-effective. This data allows for targeted optimization and informed budget allocation.
Compare CPL against Customer Lifetime Value (CLV): Ensure your CPL aligns with your overall business profitability. A high CPL might be acceptable if your CLV is significantly higher.
Use marketing automation: Streamline processes and reduce manual costs, ultimately lowering your CPL. Automation can significantly improve efficiency and lead nurturing.
Implement lead scoring: Prioritize high-quality leads and focus your efforts on prospects most likely to convert into customers. This targeted approach optimizes spending and improves ROI.
By consistently analyzing and refining your lead generation strategies with a focus on CPL, you can significantly improve the efficiency of your marketing investments and drive business growth. A well-optimized CPL strategy is key to sustainable and profitable lead acquisition.
3. Lead Quality Score
Lead quality score is a crucial lead generation KPI that predicts a lead's likelihood of converting into a paying customer. This numerical rating system evaluates prospects based on predetermined criteria. These criteria often include demographics, behavior, engagement level, and fit with your ideal customer profile (ICP). By assigning scores, you can prioritize high-potential leads, optimize resource allocation, and improve overall sales and marketing effectiveness. Understanding and leveraging lead quality scores is essential for maximizing your return on investment and achieving sustainable growth.
Calculating Lead Quality Score
While specific calculations vary depending on the chosen criteria and platform, the core principle involves assigning points based on different attributes. For instance, a lead matching your ICP might receive a higher score than someone outside it. Similarly, frequent website visits or high email engagement could contribute positively to the score. This cumulative score reflects a lead's overall potential.
Industry Benchmarks and Examples
Successful implementations of lead scoring have demonstrably improved business outcomes. Salesforce reported a 30% increase in conversion rates by leveraging lead scoring. Marketo customers report a 50% increase in sales productivity. Moreover, companies utilizing lead scoring generally see a 77% increase in lead generation ROI. These examples highlight the significant impact of this KPI on business performance.
Optimizing Your Lead Quality Score
Refining your lead scoring system requires a continuous improvement approach. Start with simple criteria and gradually add complexity as you gather more data.
Regular Review: Continuously review and adjust your scoring model based on actual conversion data. This helps maintain alignment with your sales process and buyer behavior.
Holistic Scoring: Incorporate both explicit factors (demographics, job title) and implicit factors (website behavior, content downloads) to create a comprehensive view of lead potential.
Sales Alignment: Collaborate with your sales team to ensure the scoring criteria align with their insights and qualification process. This fosters a shared understanding of lead quality and prioritization.
By consistently analyzing and refining your lead scoring criteria, you can effectively identify and prioritize high-potential leads. This ultimately contributes to improved sales efficiency, increased conversion rates, and accelerated business growth. Focusing on lead quality allows you to allocate resources effectively and target the most promising prospects within the sales funnel. This strategic approach is critical for businesses seeking scalable lead acquisition and improved ROI on marketing and sales efforts.
4. Lead Volume
Lead volume is a foundational lead generation KPI that measures the total number of new leads generated within a specific timeframe, typically monthly or quarterly. This metric provides essential insights into the scale and consistency of your lead generation efforts. Tracking lead volume serves as a baseline for evaluating marketing campaign effectiveness and overall sales pipeline health. It’s a crucial indicator of your ability to attract potential customers and fuel your sales process.
Calculating Lead Volume
Calculating lead volume is straightforward: simply count the number of new leads acquired within your chosen reporting period. This raw number, while simple, provides a critical overview of your lead generation performance. It’s important to differentiate between raw leads and qualified leads. While lead volume focuses on the sheer number of leads, further qualification processes are needed to determine their sales readiness.
Industry Benchmarks and Examples
Average lead volume varies significantly across industries. SaaS companies typically generate 100-500 leads per month, while B2B service companies might average 50-200 monthly leads. E-commerce businesses, due to their high-volume nature, may generate 1000+ leads monthly. Understanding these benchmarks helps you set realistic expectations and evaluate your performance relative to your competitors. For example, if your SaaS business generates only 50 leads per month, it might signal a need to re-evaluate your lead generation strategies.
Optimizing Your Lead Volume
Increasing your lead volume requires a multifaceted approach. Start by setting realistic monthly and quarterly lead volume targets aligned with your business objectives. Track volume trends to identify seasonal patterns and adjust your strategies accordingly. Segment lead volume by source (e.g., organic search, paid advertising, referrals) to optimize your channel mix. This will highlight which channels are most effective at generating leads. For example, if social media campaigns contribute a significant portion of your lead volume, you might consider increasing investment in those channels. Finally, remember to balance volume goals with quality metrics. A high volume of low-quality leads won't necessarily translate into increased sales.
Effective outbound lead generation strategies can significantly impact lead volume. Learn more about lead volume and effective outbound strategies that convert. By focusing on strategic initiatives and consistent monitoring, you can effectively increase your lead volume and contribute to sustainable business growth.
5. Lead to Customer Conversion Rate
Lead to Customer Conversion Rate is a crucial lead generation KPI that measures the effectiveness of your entire sales and marketing funnel. It represents the percentage of qualified leads that ultimately convert into paying customers. This metric provides a holistic view of your lead generation and sales processes, highlighting the quality of your leads and the efficiency of your conversion strategies. Understanding and optimizing this rate is essential for sustainable revenue growth.
Calculating Lead to Customer Conversion Rate
Calculating this KPI is simple:
(Number of New Customers / Number of Qualified Leads) * 100 = Lead to Customer Conversion Rate
For example, if you had 100 qualified leads and 5 converted into customers, your Lead to Customer Conversion Rate is 5%. This seemingly small percentage can significantly impact your bottom line, especially as your lead generation efforts scale.
Industry Benchmarks and Examples
Benchmarking your performance against industry averages is essential. B2B software companies typically see 2-5% lead-to-customer conversion rates. Professional services often achieve higher rates, averaging 10-15%. E-commerce businesses, dealing with a higher volume of leads but often lower purchase values, may achieve rates of 1-3%. These variances highlight the importance of understanding your specific industry context.
Optimizing Your Lead to Customer Conversion Rate
Improving your Lead to Customer Conversion Rate requires a strategic approach focused on both marketing and sales alignment. Here are several actionable tips:
Implement proper lead tracking: Track leads throughout the entire sales cycle to identify bottlenecks and areas for improvement. This granular view helps pinpoint drop-off points and inform targeted optimizations.
Regularly review and optimize lead handoff processes: Ensure a seamless transition between marketing and sales. A well-defined handoff process minimizes lead leakage and maximizes conversion opportunities.
Use lead scoring: Implement a lead scoring system to prioritize high-quality leads. This allows sales teams to focus their efforts on the most promising prospects, improving conversion efficiency.
Analyze conversion rates by lead source: Understand which lead sources generate the highest quality leads. This allows for better budget allocation and targeted optimization of marketing campaigns.
Learn more about Lead to Customer Conversion Rate in our complete guide to SaaS lead generation: Learn more about.... By continuously analyzing and refining your strategies, you can significantly improve your lead to customer conversion rate and drive sustainable revenue growth. This metric is a powerful indicator of overall business health and provides a clear pathway for optimization across the entire customer acquisition funnel. Focusing on this KPI, along with other crucial lead generation metrics, will contribute significantly to long-term success.
6. Time to Conversion
Time to Conversion is a crucial lead generation KPI that measures the average duration it takes for a lead to become a paying customer. This metric, also known as sales cycle length, provides valuable insights into the efficiency of your sales and marketing funnel. Understanding your Time to Conversion is essential for forecasting revenue, planning resources, and optimizing your lead nurturing strategies. It allows you to anticipate cash flow, identify potential bottlenecks, and improve overall sales performance.
Calculating Time to Conversion
Calculating Time to Conversion involves tracking the time elapsed between the initial point of contact (e.g., lead capture) and the final conversion (e.g., closed deal). The formula is simple:
(Date of Conversion - Date of Lead Capture) / Number of Conversions = Average Time to Conversion
For example, if you closed 10 deals in a month, and the total time between lead capture and conversion for all deals was 200 days, your average Time to Conversion would be 20 days.
Industry Benchmarks and Examples
Time to Conversion varies significantly across industries and business models. B2B SaaS companies typically see an average conversion time of 30-90 days. Enterprise software sales cycles can range from 6-18 months, while B2C services often have shorter conversion times, typically 1-14 days. Complex B2B solutions frequently require 3-12 months to close a deal. These differences highlight the importance of understanding your specific industry context when analyzing your own Time to Conversion.
Optimizing Your Time to Conversion
Reducing your Time to Conversion requires a strategic approach focused on streamlining your sales process and nurturing leads effectively. Here are some actionable tips:
Track conversion time by lead source: This helps identify high-performing channels and optimize your channel strategy. You might discover, for example, that leads from referrals convert much faster than leads from paid advertising.
Identify and address bottlenecks: Analyze your sales process for common delays or roadblocks. This could involve improving lead qualification, simplifying pricing structures, or enhancing sales team training.
Use automation: Implement marketing automation tools to nurture leads throughout the sales cycle. This can include automated email sequences, personalized content delivery, and targeted follow-up reminders. Learn more about nurturing leads through cold email strategies, which can significantly impact your Time to Conversion, in this article: Learn more about Time to Conversion.
Set appropriate follow-up schedules: Base your follow-up cadence on your average Time to Conversion and industry best practices. Consistent and timely follow-up can significantly accelerate the sales cycle.
By actively monitoring and optimizing your Time to Conversion, you can improve sales forecasting accuracy, accelerate revenue growth, and enhance overall business performance. This KPI is a powerful tool for understanding your sales cycle dynamics and making data-driven decisions to improve your lead generation efforts.
7. Lead Source Attribution
Lead source attribution is a critical lead generation KPI that identifies the origin of your leads. It involves tracking and analyzing where leads come from, including channels like organic search, paid advertising, social media, email campaigns, referrals, and direct traffic. This KPI provides invaluable insights into which marketing efforts are most effective in driving lead generation. Understanding your lead sources empowers data-driven decision-making for budget allocation and strategy optimization.
Calculating Lead Source Attribution
Calculating lead source attribution requires implementing tracking mechanisms across your marketing channels. This typically involves:
Using UTM parameters: These tags appended to your URLs allow you to track the source, medium, and campaign of each lead.
CRM integration: Connect your marketing platforms with your CRM to automatically capture lead source information.
Marketing automation platforms: These tools provide built-in attribution features to streamline tracking and reporting.
By accurately tracking these elements, you gain a clear picture of how each channel contributes to your overall lead generation efforts.
Industry Benchmarks and Examples
While specific benchmarks vary by industry, understanding general trends can be helpful. For many businesses, organic search often accounts for a significant portion of leads (40-60%). Paid search can generate 20-30% of leads, while social media contributes 5-15% depending on the industry and target audience. Email marketing typically drives 10-25% of qualified leads. For example, a SaaS company might find that their primary lead sources are organic search (50%), paid advertising (25%), and referrals (15%).
Optimizing Your Lead Source Attribution
To maximize the value of lead source attribution, consider these tips:
Use UTM parameters consistently: Ensure all your marketing campaigns utilize UTM parameters for accurate tracking.
Implement first-party data collection: Reduce reliance on third-party cookies by prioritizing first-party data strategies.
Regularly audit and clean up tracking systems: Maintain accurate data by periodically reviewing and correcting any discrepancies in your tracking setup.
Consider multi-touch attribution models: Recognize that leads often interact with multiple touchpoints before converting. Multi-touch models provide a more holistic view of the customer journey.
By implementing these strategies, you can gain a deeper understanding of how your marketing channels interact and contribute to lead generation. You can Learn more about Lead Source Attribution and other strategies to grow leads and build loyalty. Analyzing and refining your attribution model allows you to allocate budget effectively and optimize campaigns for maximum ROI.
Lead Generation KPIs Comparison
KPI | Implementation Complexity 🔄 | Resource Requirements ⚡ | Expected Outcomes 📊 | Ideal Use Cases 💡 | Key Advantages ⭐ |
|---|---|---|---|---|---|
Lead Conversion Rate | Low - simple calculation and tracking | Low - basic analytics tools needed | Measures lead generation effectiveness | Optimizing content, campaigns, quick ROI check | Easy to calculate, direct revenue correlation |
Cost Per Lead (CPL) | Medium - requires accurate spend data | Medium - finance & marketing data | Identifies cost efficiency of lead acquisition | Budget allocation, channel performance analysis | Clear ROI visibility, helps budget optimization |
Lead Quality Score | High - setting criteria & integration | High - CRM & automation systems | Prioritizes leads by likelihood to convert | Sales prioritization, targeted follow-up | Improves sales focus, increases conversion rates |
Lead Volume | Low - simple numeric tracking | Low - basic reporting tools | Tracks scale and consistency of leads | Resource planning, campaign baseline measurement | Easy to measure, supports goal setting |
Lead to Customer Conversion Rate | Medium - requires end-to-end tracking | Medium - CRM and sales data | Measures final funnel effectiveness | Sales & marketing alignment, revenue forecasting | Direct link to revenue, identifies funnel bottlenecks |
Time to Conversion | Medium - track leads through sales cycle | Medium - tracking & analytics needed | Understands sales cycle length | Sales forecasting, nurturing optimization | Enables forecasting, identifies bottlenecks |
Lead Source Attribution | High - multi-channel tracking & modeling | High - advanced tracking systems | Shows which channels generate highest quality leads | Marketing strategy & budget allocation | Strategic budget allocation, channel performance insight |
Supercharging Your Lead Generation: Putting KPIs into Action
This article has explored seven key lead generation KPIs crucial for any business aiming to scale its customer acquisition efforts. From understanding your Lead Conversion Rate and Cost Per Lead (CPL) to measuring the effectiveness of your campaigns with Lead Quality Score and Lead Source Attribution, these metrics offer a comprehensive view of your lead generation funnel. By actively monitoring these KPIs, you can identify areas for improvement, optimize your campaigns, and ultimately drive revenue growth.
Key Takeaways: Actionable Insights for Success
Let's recap the most important takeaways from our discussion of lead generation KPIs:
Data-Driven Decisions: KPIs empower you to move beyond guesswork and base your marketing strategies on concrete data. This allows for more effective resource allocation and campaign optimization.
Continuous Improvement: Regularly tracking these metrics enables you to identify trends, pinpoint bottlenecks, and continuously refine your lead generation process. This iterative approach fosters ongoing improvement and maximizes your return on investment.
Targeted Optimization: Each KPI provides unique insights into a specific aspect of your lead generation funnel, allowing you to address specific weaknesses and capitalize on strengths.
Sustainable Growth: Mastering these KPIs helps you build a predictable and scalable lead generation engine. This translates to consistent growth and long-term success.
The Power of Predictive Analytics
Utilizing lead generation KPIs doesn't just tell you what happened in the past; it empowers you to predict future performance. By analyzing trends and patterns in your data, you can anticipate potential challenges and proactively adjust your strategies. This predictive capability is particularly valuable in today's dynamic market.
From Metrics to Meaningful Action: Next Steps
To truly leverage the power of lead generation KPIs, you must move beyond simply tracking them. Take these actionable steps:
Set Clear Goals: Define your target values for each KPI based on your business objectives and industry benchmarks.
Implement Tracking Mechanisms: Ensure you have the necessary tools and systems in place to accurately collect and monitor your chosen KPIs.
Regularly Analyze Your Data: Don't just collect data; analyze it regularly to identify trends and pinpoint areas for improvement.
Test and Iterate: Continuously experiment with different strategies and tactics to optimize your lead generation efforts based on your KPI data.
By consistently monitoring, analyzing, and acting on these key metrics, you can transform your lead generation process into a powerful engine for sustainable business growth. These insights enable you to target the right audience, optimize your campaigns for maximum impact, and ultimately achieve your revenue goals.
Ready to supercharge your lead generation efforts and unlock your full potential? Fypion Marketing specializes in data-driven lead generation strategies, helping businesses like yours achieve scalable and predictable results. Visit Fypion Marketing to learn how our expertise in leveraging lead generation KPIs can drive significant growth for your business.
Comments